Most important takeaways…
- California offers the highest raw median NP salary at $168,520 but cost of living is 42% above average.
- Oklahoma provides the best purchasing power with a cost-of-living-adjusted NP salary of $152,272.
- Nationally, NP median annual wage is $129,210, with over 307,000 employed.
The median annual wage for nurse practitioners sits at $129,210, according to the latest U.S. Bureau of Labor Statistics data. That figure anchors a national landscape where state-level pay diverges sharply. In California, the raw median salary reaches $168,520; in Alabama, it drops to $105,750.
A six-figure income pays different bills depending on your ZIP code. Cost-of-living differences can flip the financial appeal of a state entirely, making some lower-salary markets more lucrative after adjusting for expenses. Where you choose to practice shapes your real earning power more than any specialty certification or degree level.
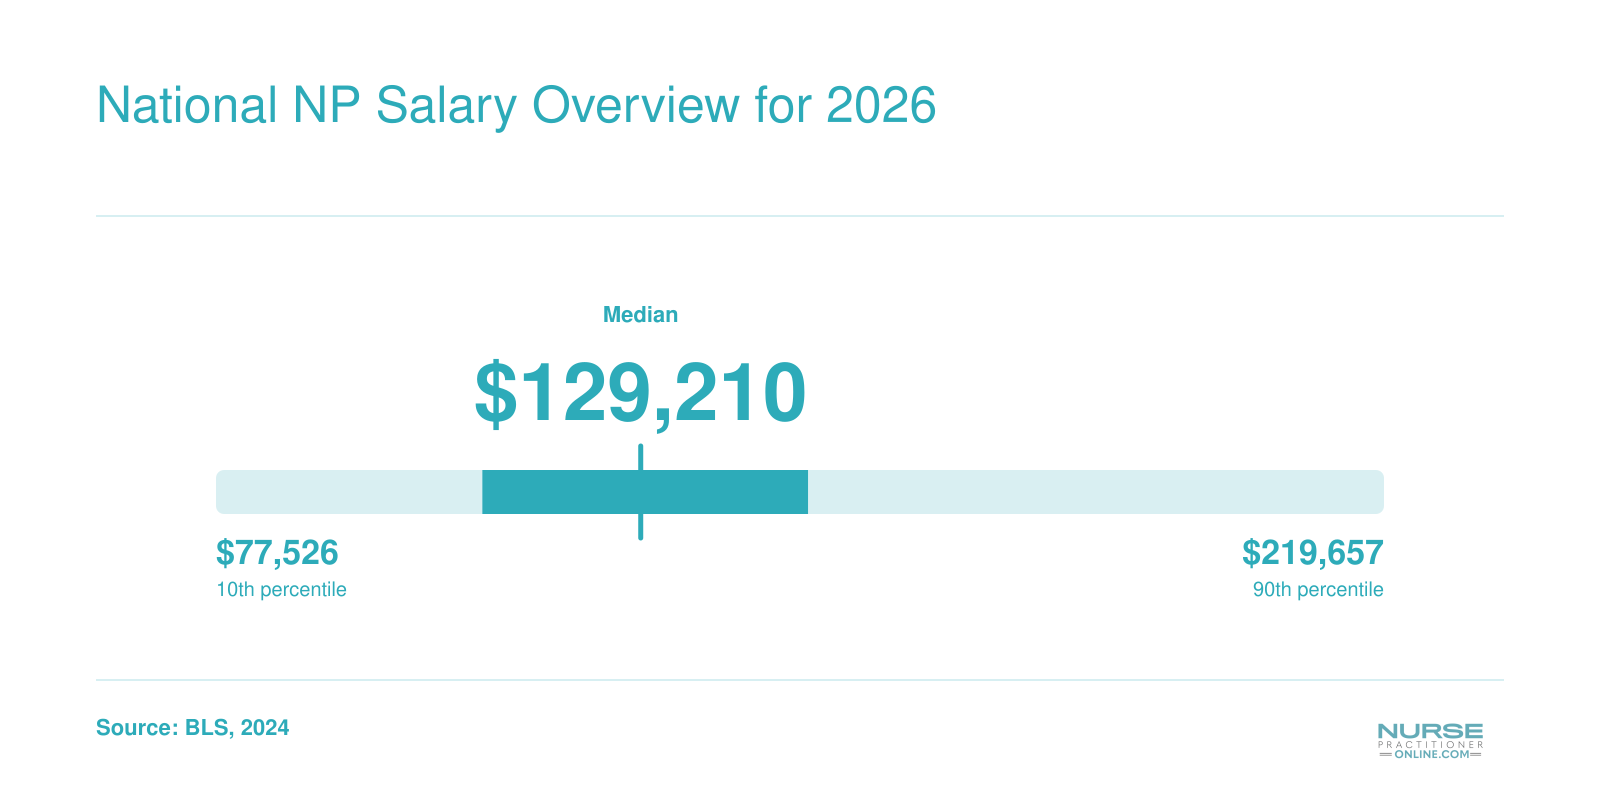
National NP Salary Overview for 2026
According to the U.S. Bureau of Labor Statistics (BLS) 2024 survey, the median annual wage for nurse practitioners is $129,210, with a mean of $132,000. The middle 50% earn between $109,940 and $149,570. Over 307,000 NPs are employed nationally, reflecting strong demand. These salaries require an MSN or DNP and AANP or ANCC board certification, setting NP pay well above the RN average.
NP Salary by State: Complete 2026 Rankings
According to the latest analysis from allnurses.com, California offers the highest raw median salary for nurse practitioners at $168,520, while Alabama sits at the opposite end with $105,750. Our table below draws from U.S. Bureau of Labor Statistics data to rank states by median pay, revealing California again near the peak at $166,610. Keep in mind that raw dollars don't tell the whole story; we'll cover cost-of-living adjustments that change the picture significantly in the next section.
| State | Annual Median Salary | 25th Percentile | 75th Percentile | Total Employment |
|---|---|---|---|---|
| California | 166610 | 140260 | 205400 | 20980 |
| New Jersey | 149620 | 126030 | 162250 | 9590 |
| Alaska | 145450 | 104000 | 165510 | 570 |
| New York | 145390 | 128190 | 164670 | 20430 |
| Oregon | 144600 | 129840 | 163240 | 2430 |
| Washington | 140220 | 125890 | 161730 | 4790 |
| Connecticut | 138960 | 125910 | 159680 | 3680 |
| Massachusetts | 138890 | 125590 | 160310 | 8920 |
| New Mexico | 138440 | 113240 | 156000 | 1870 |
| Arizona | 133790 | 115290 | 151650 | 7540 |
| Montana | 133640 | 112180 | 141050 | 1050 |
| New Hampshire | 132440 | 120270 | 143010 | 1790 |
| District of Columbia | 131380 | 119240 | 143960 | 790 |
| Hawaii | 130940 | 121410 | 158100 | 470 |
| Rhode Island | 130710 | 126200 | 160030 | 1200 |
| Texas | 129880 | 110570 | 143860 | 21690 |
| Colorado | 129750 | 110300 | 139440 | 4130 |
| Vermont | 129740 | 115650 | 139930 | 680 |
| Iowa | 129420 | 115950 | 137900 | 2810 |
| Florida | 129010 | 109670 | 143670 | 24690 |
| Idaho | 128940 | 119290 | 140920 | 1570 |
| Illinois | 128620 | 111450 | 138420 | 9560 |
| Wisconsin | 128580 | 117630 | 137150 | 4950 |
| Minnesota | 128570 | 103250 | 139590 | 8690 |
| Indiana | 128280 | 111210 | 134840 | 7470 |
Cost-Of-Living Adjusted NP Salaries by State
What Cost-of-Living Adjustment Actually Means for Your Paycheck
A high salary number looks impressive but only tells half the story. What you really care about is how far that paycheck goes after you cover housing, groceries, transportation, and healthcare. That’s where the cost-of-living index comes in. We take each state’s raw median NP salary, pulled from the latest BLS data as compiled by allnurses.com, and adjust it using the formula:
Adjusted Salary = (Raw Median Salary ÷ Cost-of-Living Index) × 100
An index of 100 equals the national average cost of living. Numbers above 100 mean the state is more expensive; below 100 means it’s cheaper. For this article we used the Q1 2026 Cost of Living Index from the Missouri Economic Research and Information Center (MERIC), a trusted public dataset that updates quarterly.
Using this adjustment, some of the “highest paying” states suddenly look a lot less attractive, while lower-profile states move to the top of the list. Let’s walk through a few standout examples, and you can find the complete re-ranked table, raw salary, COL index, and adjusted purchasing power for every state, right on this page.
A Tale of Two States: California vs. Oklahoma
America’s two nurse practitioner salary extremes illustrate the COL adjustment perfectly.
- California: Raw median salary $168,520 with a COL index of 142.2 (1.42 times the national average). After adjustment that salary shrinks to roughly $118,500. Suddenly the nation’s highest-paying state for NPs delivers middle-of-the-pack buying power.
- Oklahoma: Raw median salary around $133,400 but a COL index of just 87.6. According to the salary analysis on allnurses.com, that translates into an adjusted purchasing power of $152,272, thousands more than the raw California figure.
In other words, an NP practicing in Oklahoma can afford a lifestyle that would require over $168,000 a year to replicate in California. Locations aren’t just about numbers on a paycheck.
The Bottom of the Raw Rankings Gets a Big Lift
Low raw salaries don’t always mean low real-world earnings. Take Alabama, which reports the lowest raw median NP salary at $105,750. With a 2026 Q1 COL index of 85.0, its adjusted salary jumps to approximately $124,400. That’s still below the national top 10, but it closes the gap dramatically and exceeds the adjusted figure of some higher-nominal states.
Similar dynamics play out across the Southeast and Midwest. States like Mississippi (COL index 86.2), Kansas (87.6), West Virginia (87.9), and Indiana (88.3) all see their effective earnings climb significantly once you factor in rent, utilities, and daily expenses. In many cases, these states offer a stronger financial footing than coastal hubs with eye-popping nominal salaries but brutal living costs.
See the Full State-by-State Adjusted Rankings
The examples above are just a snapshot. The earlier salary ranking table in this article includes every state’s raw median NP wage alongside its MERIC cost-of-living index and the resulting adjusted salary, so you can scan the top 10 and bottom 5 at a glance. Use it to map out where your next career move will actually pay off, not just on paper but in your day-to-day life.
Which State Pays Nurse Practitioners the Most?
When evaluating NP earning potential across states, you face a choice: focus on the top-line salary figure or factor in local cost of living. A state with a gaudy six-figure median might still leave you with less disposable income than a lower-paying but far more affordable region. The 2026 numbers make this tradeoff crystal clear.
Raw Salary Leaders
California stands alone at the top. According to the AllNurses NP salary report (updated June 2026), the Golden State offers a median annual wage of $168,520 for nurse practitioners. Other coastal and Northeast states, such as New Jersey, Washington, Massachusetts, and Oregon, regularly appear in the top tier, with medians well above $130,000. These figures reflect high demand, strong unionization in some areas, and the sheer expense of operating a healthcare practice. But raw dollars do not pay your mortgage or buy groceries.
Purchasing Power Champions
When you adjust for the cost of living, the leaderboard shifts. The AllNurses report highlights a striking example: Oklahoma, with a median NP salary lower than the national average, delivers the equivalent of $152,272 in purchasing power thanks to a cost-of-living index of just 87.6. By that same measure, many Southern and Midwestern states, such as Alabama, Mississippi, Iowa, and Kansas, offer take-home comfort that rivals or exceeds the coastal giants. A California NP earning $168,520 in a region where the cost-of-living index is 142.2 may feel pinched compared to a peer in a low-cost state earning $120,000. The lesson: always layer living expenses over the salary data.
Does Full Practice Authority Boost Pay?
You might assume that states letting NPs practice independently pay more. But the reality is more nuanced. As of 2026, 27 states plus Washington, D.C., grant full practice authority to nurse practitioners. Surprisingly, salary analyses have not found a consistent statewide wage premium linked to practice authority alone. Many full-practice states, like Alaska and Arizona, pay well, but so do restricted states like California and Florida. Conversely, reduced-practice states such as Illinois and Pennsylvania also land near the top of raw salary rankings. Practice autonomy may open entrepreneurship doors and increase job satisfaction, but current evidence does not tie it directly to higher statewide NP pay.
The Takeaway
If you are planning your next career move, start with the salary table available on this page, then run the numbers through a cost-of-living calculator. A full-practice state with a mid-range salary can be a hidden gem if it means you can open your own practice and live comfortably. Combining practice environment data from the AANP with salary data from sources like AllNurses gives you a 360-degree view, so you can choose a state that fits both your professional goals and your budget.
Highest-Paying Metro Areas for Nurse Practitioners
Some of the nation's top-paying metro areas for nurse practitioners also host the largest numbers of employed NPs, creating high opportunity density. The following table uses 2024 BLS OEWS data to show median, percentile, and mean annual wages alongside total employment for major urban centers.
| Metro Area | Total Employment | Mean Annual Wage | 25th Percentile | Median Annual Wage | 75th Percentile |
|---|---|---|---|---|---|
| Los Angeles-Long Beach-Anaheim, CA | 6,400 | $165,030 | $140,230 | $164,510 | $184,670 |
| New York-Newark-Jersey City, NY-NJ | 19,850 | $151,510 | $135,120 | $152,790 | $167,870 |
| Boston-Cambridge-Newton, MA-NH | 6,660 | $146,850 | $126,120 | $138,890 | $161,750 |
| Miami-Fort Lauderdale-West Palm Beach, FL | 9,200 | $132,730 | $109,990 | $135,450 | $150,840 |
| Phoenix-Mesa-Chandler, AZ | 5,970 | $132,670 | $115,290 | $134,630 | $151,670 |
| Houston-Pasadena-The Woodlands, TX | 4,680 | $133,380 | $118,610 | $133,140 | $143,760 |
| Dallas-Fort Worth-Arlington, TX | 5,300 | $130,980 | $114,990 | $131,910 | $154,240 |
| Chicago-Naperville-Elgin, IL-IN | 6,930 | $131,580 | $114,540 | $131,690 | $141,010 |
| Philadelphia-Camden-Wilmington, PA-NJ-DE-MD | 5,780 | $133,360 | $115,400 | $131,590 | $147,900 |
| Washington-Arlington-Alexandria, DC-VA-MD-WV | 4,430 | $131,380 | $117,310 | $129,920 | $150,380 |
| Atlanta-Sandy Springs-Roswell, GA | 6,280 | $129,710 | $115,690 | $128,640 | $140,140 |
| Minneapolis-St. Paul-Bloomington, MN-WI | 5,680 | $128,740 | $106,660 | $128,570 | $139,590 |
| Tampa-St. Petersburg-Clearwater, FL | 3,810 | $125,970 | $105,410 | $128,430 | $134,190 |
| Detroit-Warren-Dearborn, MI | 3,850 | $128,140 | $114,080 | $126,110 | $135,030 |
| Nashville-Davidson--Murfreesboro--Franklin, TN | 5,380 | $112,610 | $101,520 | $116,160 | $129,590 |
Related Articles
NP Salary by Specialty: FNP, PMHNP, ACNP, AG-NP, and NNP
Choosing an NP specialty often feels like a tug-of-war between the patient population you love and the salary you need to support your family. While all advanced practice paths offer solid six-figure potential, the dollar gap between the highest- and lowest-earning specialties can exceed $30,000 a year, a difference that compounds quickly across a career.
National Median Salaries by NP Specialty
Industry surveys for 2025-2026 show consistent patterns. Here's how the five major specialties stack up nationally:
- Neonatal NP (NNP): $150,000 median; typical range $145,000-$150,000
- Psychiatric-Mental Health NP (PMHNP): $145,000 median; typical range $140,000-$145,000
- Acute Care NP (ACNP): $135,000 median; typical range $130,000-$135,000
- Family NP (FNP): $122,000 median; typical range $120,000-$125,000
- Adult-Gerontology NP (AG-NP): $120,000 median; typical range $118,000-$122,000
These figures come from the latest AANP National NP Compensation Survey, Medscape NP reports, and aggregated data from ZipRecruiter and Salary.com. The national mean for all NPs sits around $133,600, but specialty selection can push you well above or slightly below that average.
Which Specialties Earn the Top Salaries?
NNPs and PMHNPs consistently top the pay scale. The NNP premium reflects the high-acuity, high-stakes environment of the NICU and the relatively small workforce, while the PMHNP surge is fueled by a nationwide shortage of mental health providers. ACNP roles in hospitals and specialty units also command a significant premium over primary care. FNPs and AG-NPs, though foundational to the profession, sit at the lower end of the specialty salary spectrum. However, they often come with greater job volume, broader geographic flexibility, and more predictable schedules.
Regional Demand Shifts That Influence Specialty Pay
A national median only tells part of the story. In states with severe psychiatric provider gaps, like Alaska, Montana, or West Virginia, PMHNPs can negotiate salaries far above the median. FNPs in saturated metro areas may see flatter wages, while rural hospitals pay top dollar for ACNPs willing to relocate. According to the Opportunity Healthcare NP Salary Growth Plan and CompHealth's 2026 report, the top-paying states (California, New Jersey, New York, Washington, Massachusetts) reward all specialties generously, but the premium for high-demand fields like psychiatry is especially pronounced in underserved regions.
Plan Your Specialty With Long-Term Earning in Mind
Specialty certification is one of the few salary levers you control directly. Earning a post-master's certificate or DNP in a high-demand area can justify a pay increase without changing employers. Even within a specialty, sub-specialization (e.g., psych NP focused on child and adolescent, or NNP with ECMO training) can further differentiate your compensation. As you map your online NP program and certification route, weigh not just today's median but the 5- to 10-year demand outlook for your chosen role.
Questions to Ask Yourself
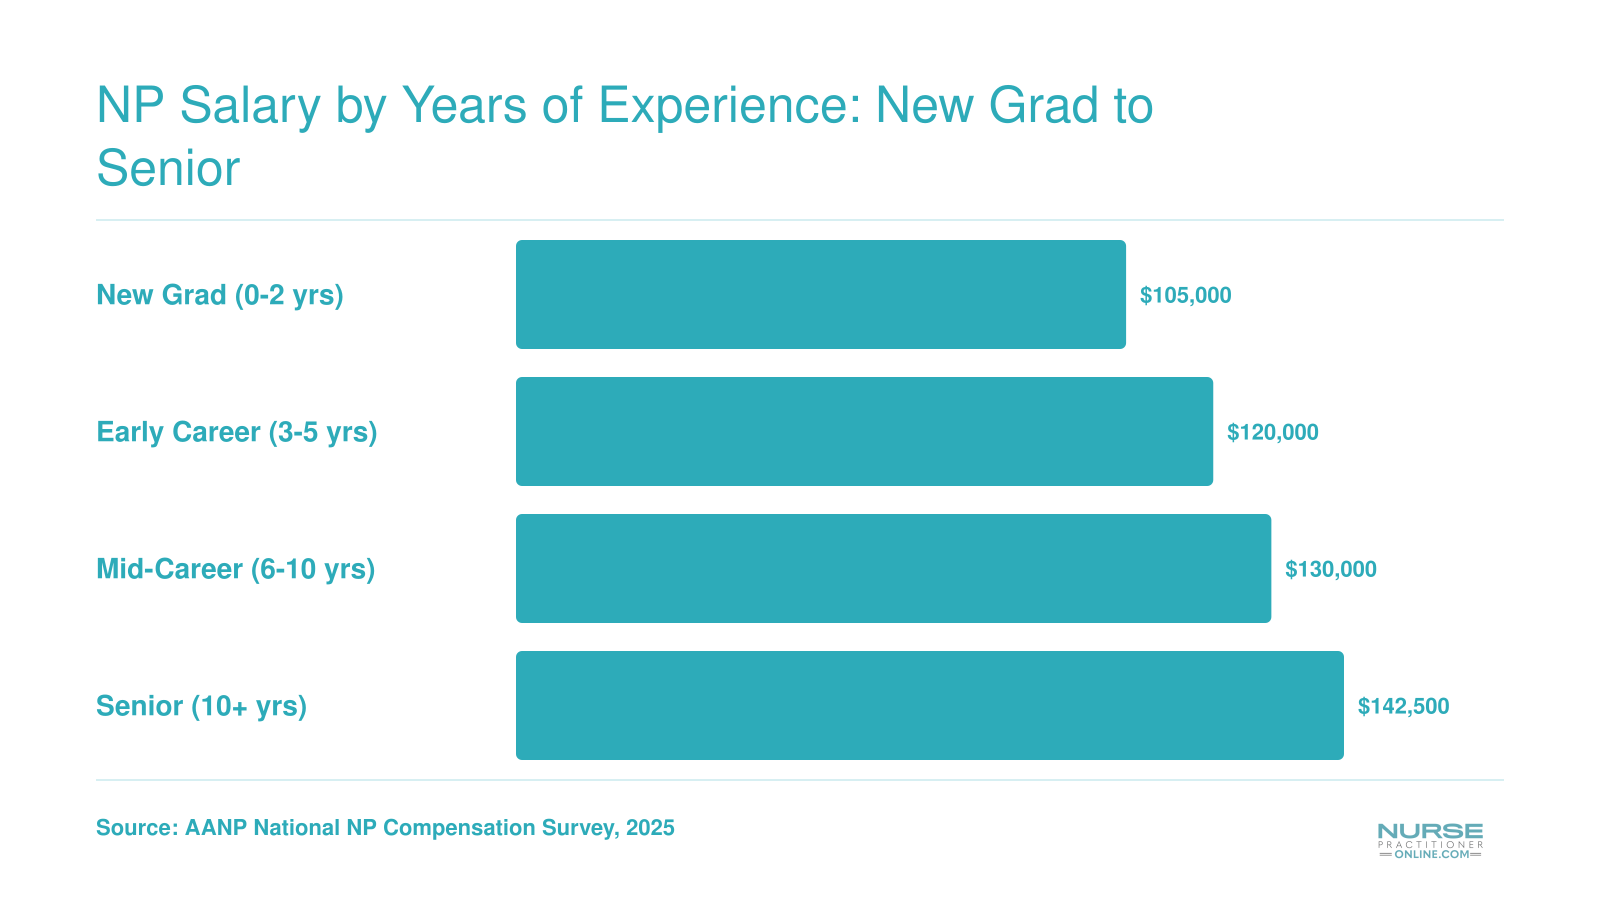
NP Salary by Years of Experience: New Grad to Senior
Your earning potential as a nurse practitioner grows significantly with each year of clinical experience. National survey data shows that the median salary for NPs climbs steadily from new graduate to senior-level roles. Notably, DNP-prepared NPs and those with specialty certifications often reach higher pay bands faster, and practicing in top-paying states further amplifies these experience-based increases.
NP Job Growth and Demand by State
Nurse practitioner job growth reflects the projected rate at which new NP positions will be created over the coming decade, indicating not just raw demand but how quickly the field is expanding. For nurses weighing where to build their careers, this metric matters as much as salary because strong growth translates into plentiful job openings, hiring flexibility, and long-term stability.
National Growth: A Profession on the Rise
The Bureau of Labor Statistics projects that employment of nurse practitioners will grow 45 percent from 2022 to 2032, making it one of the fastest-growing occupations in the country. That pace far exceeds the average for all professions and corresponds to an estimated 135,500 new NP positions by 2033. These numbers underscore what many working nurses already sense: the appetite for advanced practice providers is intense and unlikely to slow.
Which States Are Adding NP Jobs the Fastest?
Some states are sprinting ahead of the national trend. Arizona leads with a projected growth rate of 71 percent, driven by a rapidly aging population and expanding healthcare infrastructure. Right behind it, Texas (60 percent) and Florida (58.5 percent) combine booming populations with broad scope-of-practice laws. Tennessee and North Carolina follow at 58 percent and 55.5 percent, respectively, both bolstered by significant investment in outpatient and community health services.
When you look at the sheer number of new jobs expected, the picture sharpens. Texas is poised to add 11,430 net new NP roles, while Florida will see 11,070. Tennessee expects 7,880 additional positions, and Pennsylvania, with a growth rate closer to the national average at 42.7 percent, will still generate 3,420 new jobs. Alaska, by contrast, projects only 10 percent growth, a reminder that smaller, more saturated markets offer fewer opportunities.
Where Rapid Growth Meets Strong Pay
The states with the highest growth rates don't always top the raw salary rankings, but the overlap is promising. Texas and Florida, for example, rank in the upper half of NP salaries nationally while also projecting some of the biggest employment jumps. That combination means you are not only likely to find a job quickly but also to command competitive pay. It is worth noting that California, despite offering the highest average salary, has a massive existing NP workforce of 19,130, so growth rates there are less dramatic. For nurses who value both income and opportunity, the Sun Belt states often present the most compelling balance.
What Fuels State-Level Demand?
Several forces explain the variation. The aging population is a primary driver: states with large retirement communities, such as Arizona, Florida, and North Carolina, need more primary and specialty care clinicians. Medicaid expansion also plays a role by increasing the number of insured residents seeking preventive services, which NPs often deliver. Rural and underserved areas across Texas, Tennessee, and the Southeast face severe physician shortages, elevating NPs as the go-to solution for frontline care. State workforce commission projections consistently tie these factors to above-average NP job creation.
Using Growth Data to Plan Your Next Move
Why does this matter for your career? A state with high projected growth offers more than a job, it offers leverage. Employers in fast-growing markets tend to compete for talent, which can lead to sign-on bonuses, loan repayment assistance, and flexible schedules. Moreover, a robust hiring pipeline means you are better positioned to switch specialties or settings if your interests shift. When you compare states, look beyond the median salary to the long-term trajectory. The highest paycheck might be in a slow-growth region, while a state with slightly lower pay but explosive demand could deliver greater lifetime earnings and professional satisfaction.
How to Maximize Your NP Earning Potential
The NP job market in 2026 rewards strategic career moves more than ever before. While median salaries provide a helpful baseline, your actual earning potential depends on a handful of decisions you can control. Here are the five most powerful levers to raise your NP income, backed by the latest data.
1. Choose a high-demand specialty
Not all NP roles pay equally. Specialization is the single most impactful lever on your paycheck. Psychiatric mental health NPs (PMHNPs), acute care NPs (ACNPs), and neonatal NPs (NNPs) consistently earn $15,000 to $25,000 more than their primary care counterparts, according to industry salary surveys. Demand for mental health services has soared, driving PMHNP salaries upward in nearly every state. If you are still selecting a program, look for a track that aligns with both your passion and market demand.
2. Relocate to where the money goes further
Raw salary is only half the story. As the cost-of-living adjusted rankings earlier in this article show, a $168,520 paycheck in California shrinks quickly when the cost index is 142.2. Meanwhile, Oklahoma’s median of $130,450 stretches much further (index 87.6), yielding an effective purchasing power of over $152,000. Before chasing the highest nominal wage, run the numbers on housing, taxes, and daily expenses in your target city. Sometimes a “lower” salary in a low-cost state leaves you with more savings each month.
3. Upgrade your credentials from MSN to DNP
A Doctor of Nursing Practice (DNP) is an investment that can pay for itself within a few years. Many health systems add a doctoral differential of $10,000 or more to base compensation. The math is straightforward: if a DNP program costs $20,000 more than an MSN but boosts your salary by $10,000 annually, you break even in just two years, and the earnings compound over a decades-long career. Employers also value the leadership and evidence-based practice training that DNPs bring, often fast-tracking them into higher-paying administrative or educator roles.
4. Negotiate the full package, not just base pay
Base salary is just one line item. Bonuses, continuing medical education (CME) stipends, loan repayment assistance, and sign-on incentives can add $5,000 to $15,000 to your first-year total compensation. Use the state and specialty data from this article as a benchmark. When you receive an offer, counter with specific market figures: “Based on the latest BLS data, NPs in this region earn a median of X. Can we adjust the offer accordingly?” Also ask about shift differentials, on-call pay, and RVU-based bonus structures that reward productivity.
5. Expand your scope and autonomy
Practicing in a full-practice-authority state opens doors to independent practice, higher billing rates, and entrepreneurial income streams. NPs who own their clinics or work as 1099 contractors often set their own fees, potentially earning well above the employed median. Even if you stay employed, telehealth and locum tenens assignments offer flexible side income, especially in underserved rural or psychiatric settings where demand is acute and pay is premium. Check your state’s latest practice authority map and consider adding a multi-state license if mobility appeals to you.
Your earning potential as an NP is not fixed. By combining the right specialty, geography, credential, negotiation strategy, and practice setting, you can substantially outearn the national median. Before your next job change or review, revisit the salary tables in this article, research local openings, and walk into conversations armed with numbers. Small, data-informed moves now can compound into six-figure differences over the course of your career.
Frequently Asked Questions About NP Salaries
Choosing where to practice is as much about lifestyle and cost as it is about salary. These common questions break down how location, specialty, and policy affect your earning potential as a nurse practitioner.
- What is the average nurse practitioner salary in 2026?
- While state-level data dominates, the national average annual salary for nurse practitioners sits near $124,000 for 2026, according to current compensation reports. This figure masks significant geographic swings, from over $168,000 in California to roughly $106,000 in Alabama, so your specific location remains the biggest driver of earnings.
- Which state pays NP the most?
- California leads the nation with a median annual salary of $168,520, as reported in the latest BLS data reviewed in June 2026. However, high wages in the Golden State are partially offset by its 142.2 cost-of-living index, so raw numbers alone do not tell the full financial story.
- How does cost of living affect NP salary by state?
- Cost of living dramatically shifts purchasing power. For example, an NP in Oklahoma earning a raw median salary around $132,000 enjoys an adjusted equivalent of $152,272 due to the state's 87.6 cost-of-living index. Conversely, California's high index reduces real-world earnings despite the top raw number.
- What NP specialty pays the highest?
- Psychiatric-mental health nurse practitioners (PMHNPs) typically command the highest salaries among NP specialties, with median pay often exceeding $140,000 nationally. Acute care and neonatal NPs also rank near the top, reflecting the specialized skills and high demand in these areas.
- Which states have the best job growth for nurse practitioners?
- The Bureau of Labor Statistics projects the fastest NP job growth in Sunbelt states like Texas, Florida, and Arizona, driven by population expansion and healthcare infrastructure buildup. States with large rural populations, such as Georgia and North Carolina, also show robust demand as they expand primary care access.
- Do NPs earn more in states with full practice authority?
- The connection is not absolute, but evidence suggests NPs in full practice authority states often achieve higher pay, partly because they can bill directly and operate independent practices. States like Oregon and Washington exemplify this trend, though strong unionization in states like New York also pushes wages up.
- What is the average nurse practitioner hourly wage by state?
- Hourly wages track closely with annual salary data. Dividing median salaries by 2,080 hours gives a range from about $51 per hour in Alabama to roughly $81 in California. Most states cluster between $55 and $70 hourly, with cost-of-living adjustments often narrowing the effective pay gap.